
Outsourcing customer service doesn’t eliminate the need to manage it. It changes it: instead of supervising people, you monitor metrics. And if you choose the wrong metrics, the dashboard will look great while customers walk away.
Which KPIs truly measure customer service?
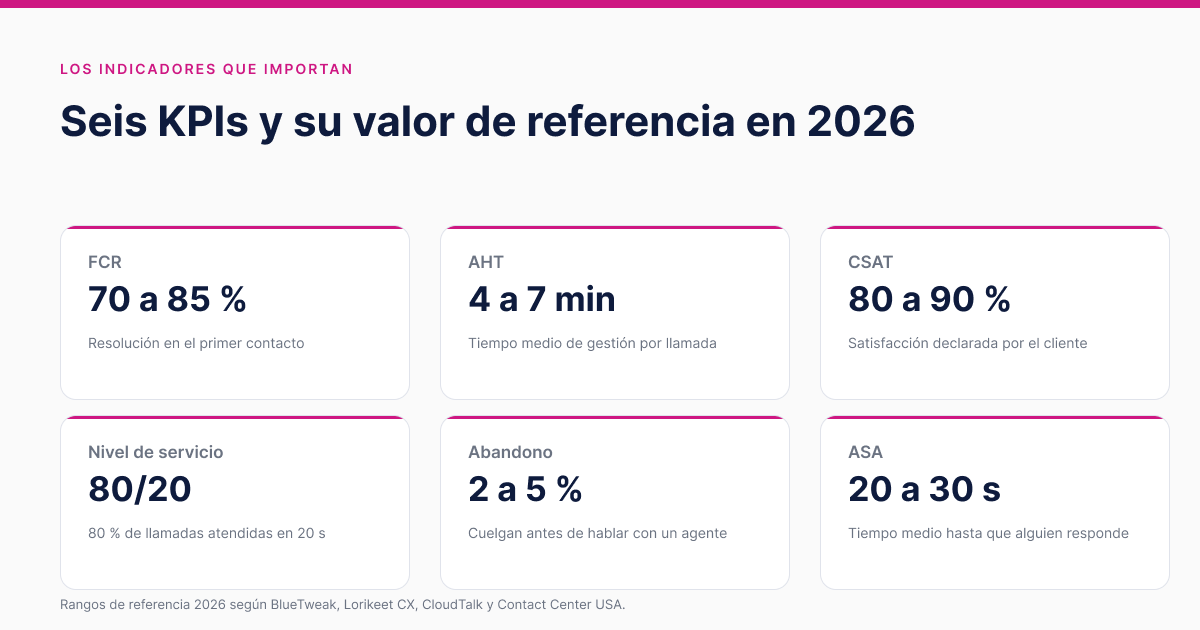
These are the six that appear in virtually all contracts in the sector, along with the ranges used as a reference this year.
| Indicator | What does it measure? | Reference 2026 |
|---|---|---|
| FCR | Cases Resolved on the First Contact | 70 to 85% |
| AHT | Average processing time | 4 to 7 minutes |
| CSAT | Satisfaction expressed after the contact | 80 to 90% |
| Level of Service | Calls Answered Within a Certain Time Frame | 80% in 20 seconds |
| Dropout rate | They hang up before talking to anyone | 2 to 5% |
| ASA | Average time until someone responds | 20 to 30 seconds |
The ranges vary by sector. Complex technical support has a higher AHT and a lower FCR by definition, and comparing it to an order-taking service doesn’t provide any useful insight. Use these numbers as a starting point, not as an automatic target.
Why Does the 80/20 Rule Fail?
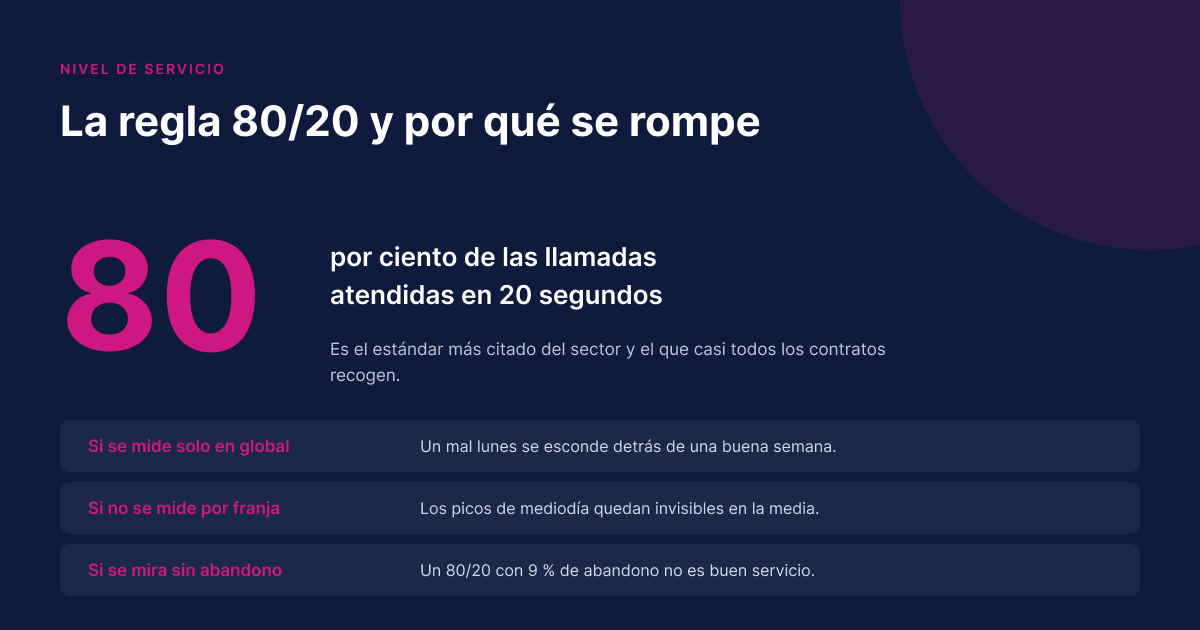
The 80/20 rule is the most common indicator and also the easiest to misinterpret. It fails in three specific situations.
- It’s measured only in aggregate. A bad Monday is hidden behind a good week, and no one notices it until the complaints start coming in.
- It is not broken down by time slot. The midday peaks are not visible within the daily average.
- It’s shown without the dropout rate next to it. If people hang up before getting in line, the calls that are actually answered look very good in the calculation.
The correction is simple: specify the service level by time slot and by day, not as a monthly figure, and always include it alongside the abandonment rate.
Volume Metrics and Quality Metrics
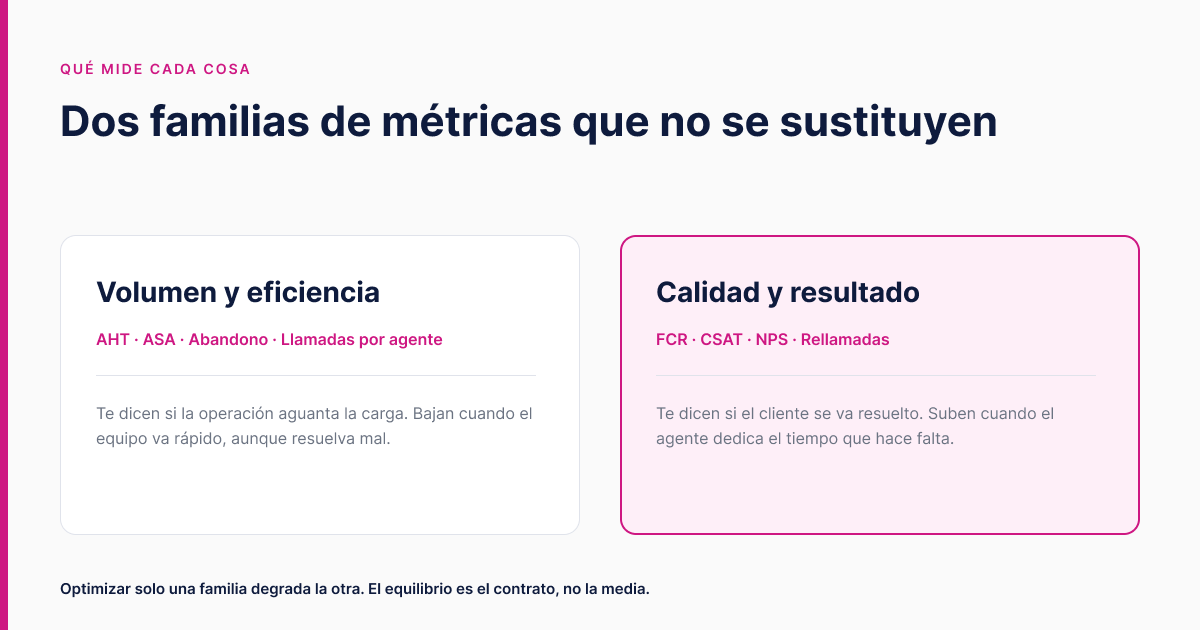
There are two categories of metrics, and optimizing one undermines the other. This is the underlying tension in any customer service operation.
Volume and Efficiency
AHT, ASA, abandonment, calls per agent. They tell you whether the operation can handle the workload. The numbers go down when the team works quickly, even if they handle calls poorly.
Quality and Results
FCR, CSAT, NPS, callbacks. These metrics tell you whether the customer’s issue has been resolved. They go up when the agent spends the necessary time on the call.
If you reward only a low AHT, the FCR drops and the number of callbacks rises. The customer calls three times instead of once, and the total volume increases while the efficiency dashboard turns green. That’s why the contract must establish a balance, not just a single number.
How often is each indicator reviewed?
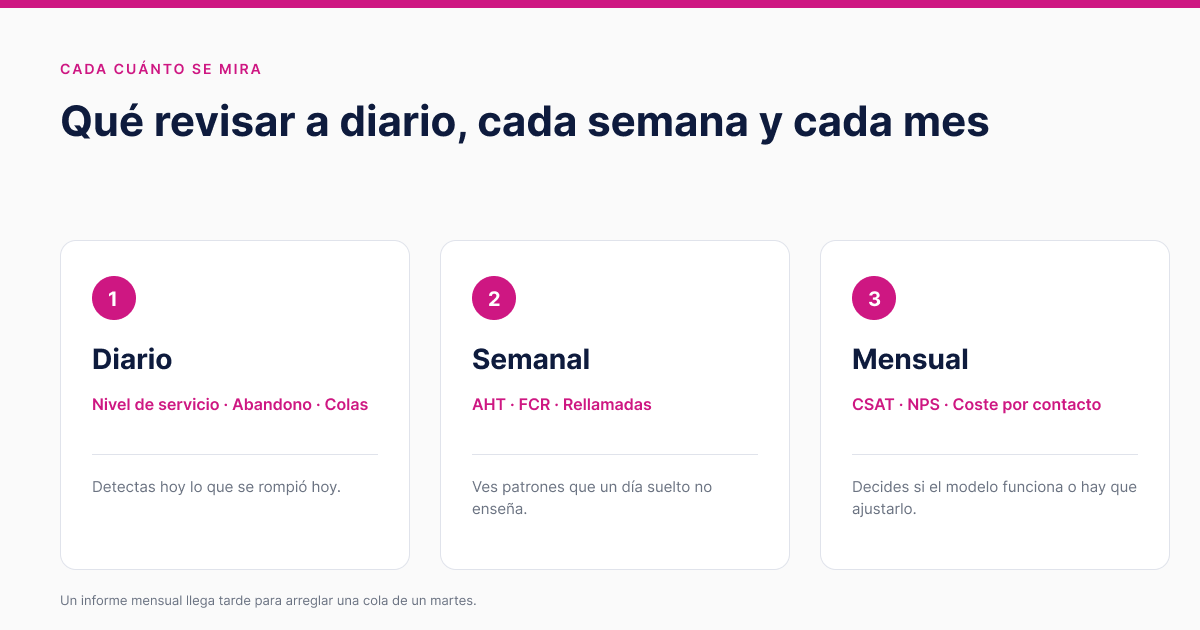
Frequency matters just as much as the choice itself. A correct piece of information that arrives too late is of no use in correcting anything.
| Frequency | What to Watch | What is it for? |
|---|---|---|
| Daily | Level of service, abandonment, wait times | Find out today what broke today |
| Weekly | AHT, FCR, callbacks | See patterns that a single day doesn’t reveal |
| Monthly | CSAT, NPS, cost per contact | Decide whether the model works or needs to be adjusted |
Five Mistakes That Make KPIs Misleading
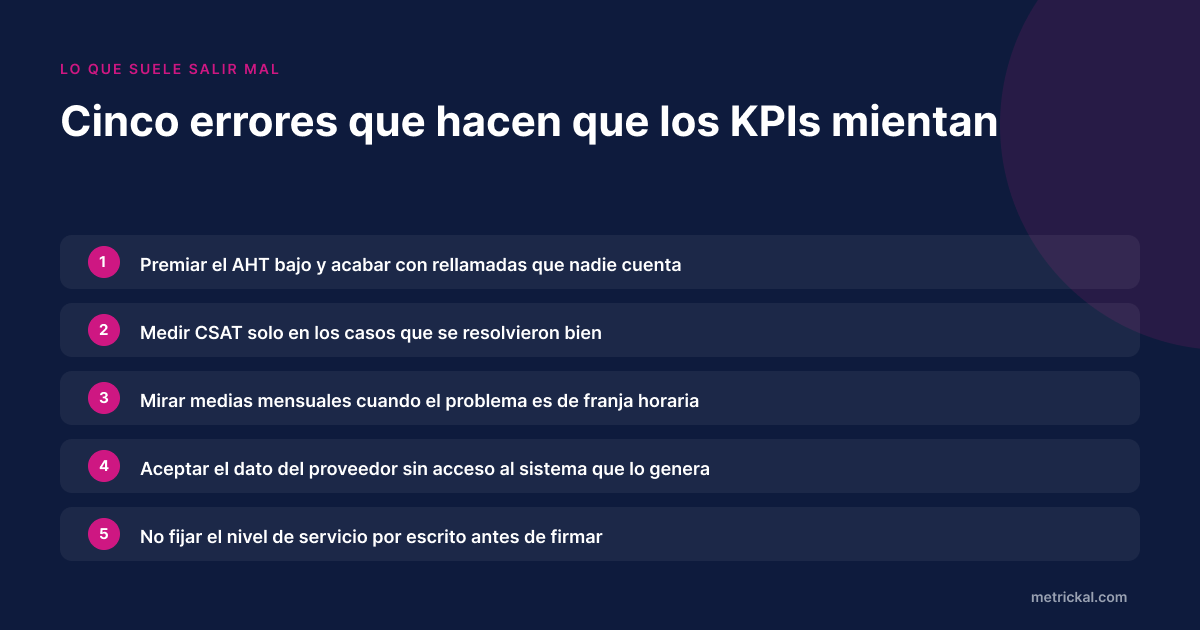
- Reward low AHT and put an end to callbacks that no one tracks.
- Measure CSAT only for cases that were resolved successfully.
- Look at monthly averages when the problem occurs during a specific time slot.
- Accept data from the supplier without access to the system that generates it.
- Do not specify the service level in writing before signing the contract.
The fifth option is the most expensive. Renegotiating a service level after the contract has already been signed and the equipment installed leaves very little room for maneuver.
How to Request This Information from Your Provider
Three specific things you should request from the outset: read-only access to the tool that generates the data—not just the PDF report; a breakdown by time slot in addition to the aggregate data; and a precise written definition of each metric, because not everyone calculates the FCR the same way.
At metrickal, we provide access to the real-time dashboard from day one and establish the service level in the contract before we get started. If you’d like to see how this applies to your operation, here’s a breakdown by city:
- Customer service in Málaga and Barcelona.
- Call center in Seville, with details on shifts and coverage.
- Back office in Madrid and Bilbao.
- And if what you’re concerned about is the cost— how much does it cost to outsource customer service in Spain?
Frequently Asked Questions
What are the most important KPIs in customer service?
The six key metrics are FCR, AHT, CSAT, service level, abandonment rate, and ASA. FCR and CSAT tell you whether the customer’s issue is resolved. Service level and abandonment rate tell you whether the system can handle the load. AHT only makes sense when viewed alongside FCR, because it’s easy to lower it at the expense of poor resolution.
What constitutes a good level of service in a call center?
The most widely used standard is the 80/20 rule: answering 80% of calls in 20 seconds or less. This is the standard included in almost all contracts. The problem arises when it’s measured only as a monthly aggregate, because a bad Tuesday at noon gets lost in a good average.
What is an acceptable dropout rate?
A range of 2% to 5% is considered healthy for 2026. Above 8%, there is a problem with staffing levels or shift scheduling, not with the number of agents. It’s important to always consider this in conjunction with the service level, because an 80/20 ratio with a 9% abandonment rate does not indicate good service.
How often should you review an external supplier’s KPIs?
Service levels, abandoned calls, and wait times on a daily basis. AHT, FCR, and callbacks every week. CSAT, NPS, and cost per contact every month. A monthly report comes too late to address a wait time issue on a specific Tuesday.
How do I know if my provider is showing me accurate data?
Request read access to the system that generates the data, not just the report. If CSAT is measured solely based on successfully closed cases or if surveys are sent out selectively, the number goes up without any actual improvement. Direct access to the tool settles the debate.
Which KPIs should be specified in writing in the contract?
At a minimum, the service level with its time window, the abandonment threshold, the timeframe for replacing an agent, and the reporting frequency. It is much more difficult to set these after signing than before.
2026 benchmark ranges compiled from BlueTweak, Lorikeet CX, CloudTalk, Contact Center USA, and Prime BPO. Values vary by industry and service complexity.